
PROGRAMMING:Survey and scoring of catering service quality (enhanced version)
The above are the original questions of PTA, which are adapted and innovated as follows:
###Task description
```
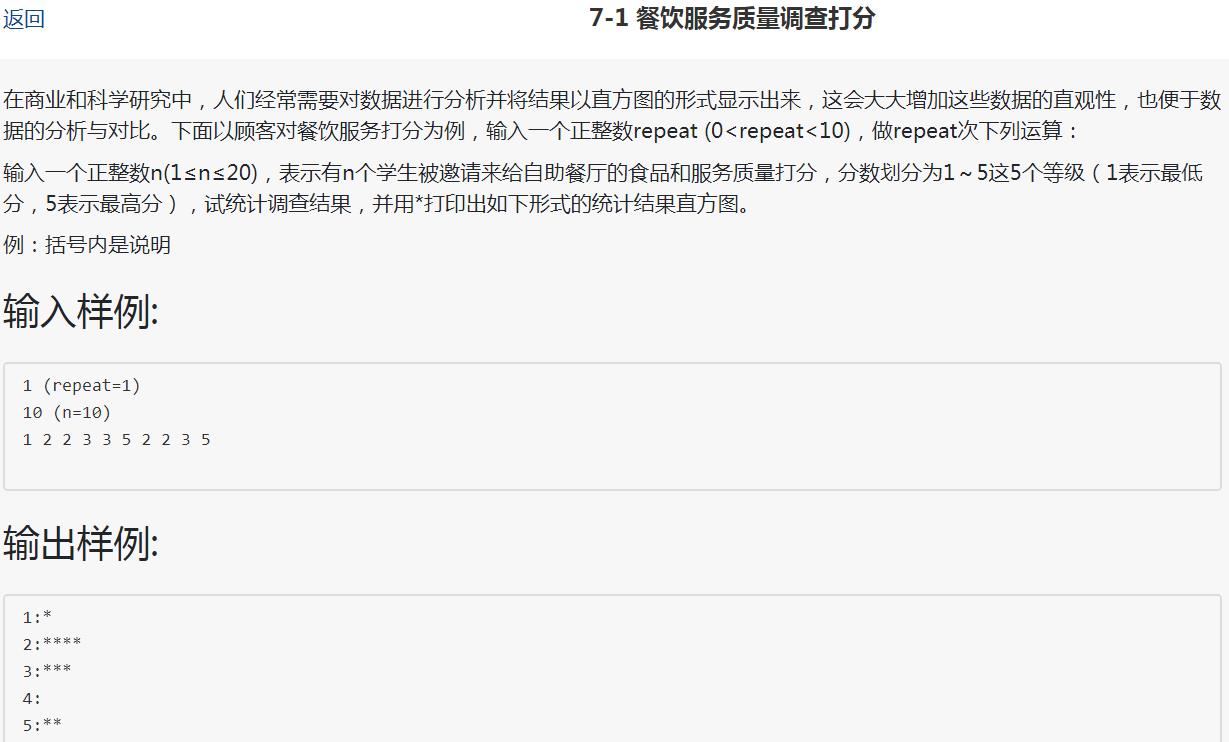
In business and scientific research, people often need to analyze the data and display the results in the form of histogram, which will greatly increase the intuitiveness of these data and facilitate the analysis and comparison of data. Take the customer's rating of catering service as an example, input a positive integer repeat (0 < repeat < 10) and perform the following operations:
Enter a positive integer n (1 ≤ n ≤ 20), which means that n students are invited to score the food and service quality of the cafeteria. The score is divided into 5 grades (1 is the lowest score, 5 is the highest score). Try to count the survey results, and print out the histogram of the statistical results in the following form with *.
```
###Input format:
```
The first integer repeat is the number of data groups. There are total repeat groups of data. Please process each group of data separately and output a histogram for each group of data.
The next is the repeat group data, the first number of each group data is the number of scoring n, and the next is the number of scoring n of these n individuals.
```
###Output format:
```
Output the results according to the style of the output sample.
```
###Input example:
```in
one
ten
1 2 2 3 3 5 2 2 3 5
```
###Output example:
```out
*
* *
* * *
* * * *
1 2 3 4 5
```
###Input example:
```in
two
ten
1 1 1 1 1 2 3 4 5 5
twenty
1 1 1 2 2 2 3 3 3 4 5 1 2 3 4 2 2 3 5 2
```
###Output example:
```out
*
*
*
* *
* * * * *
1 2 3 4 5
*
*
* *
* * *
* * *
* * * * *
* * * * *
1 2 3 4 5
```
answer:If there is no answer, please comment